Telemetry for OPEA
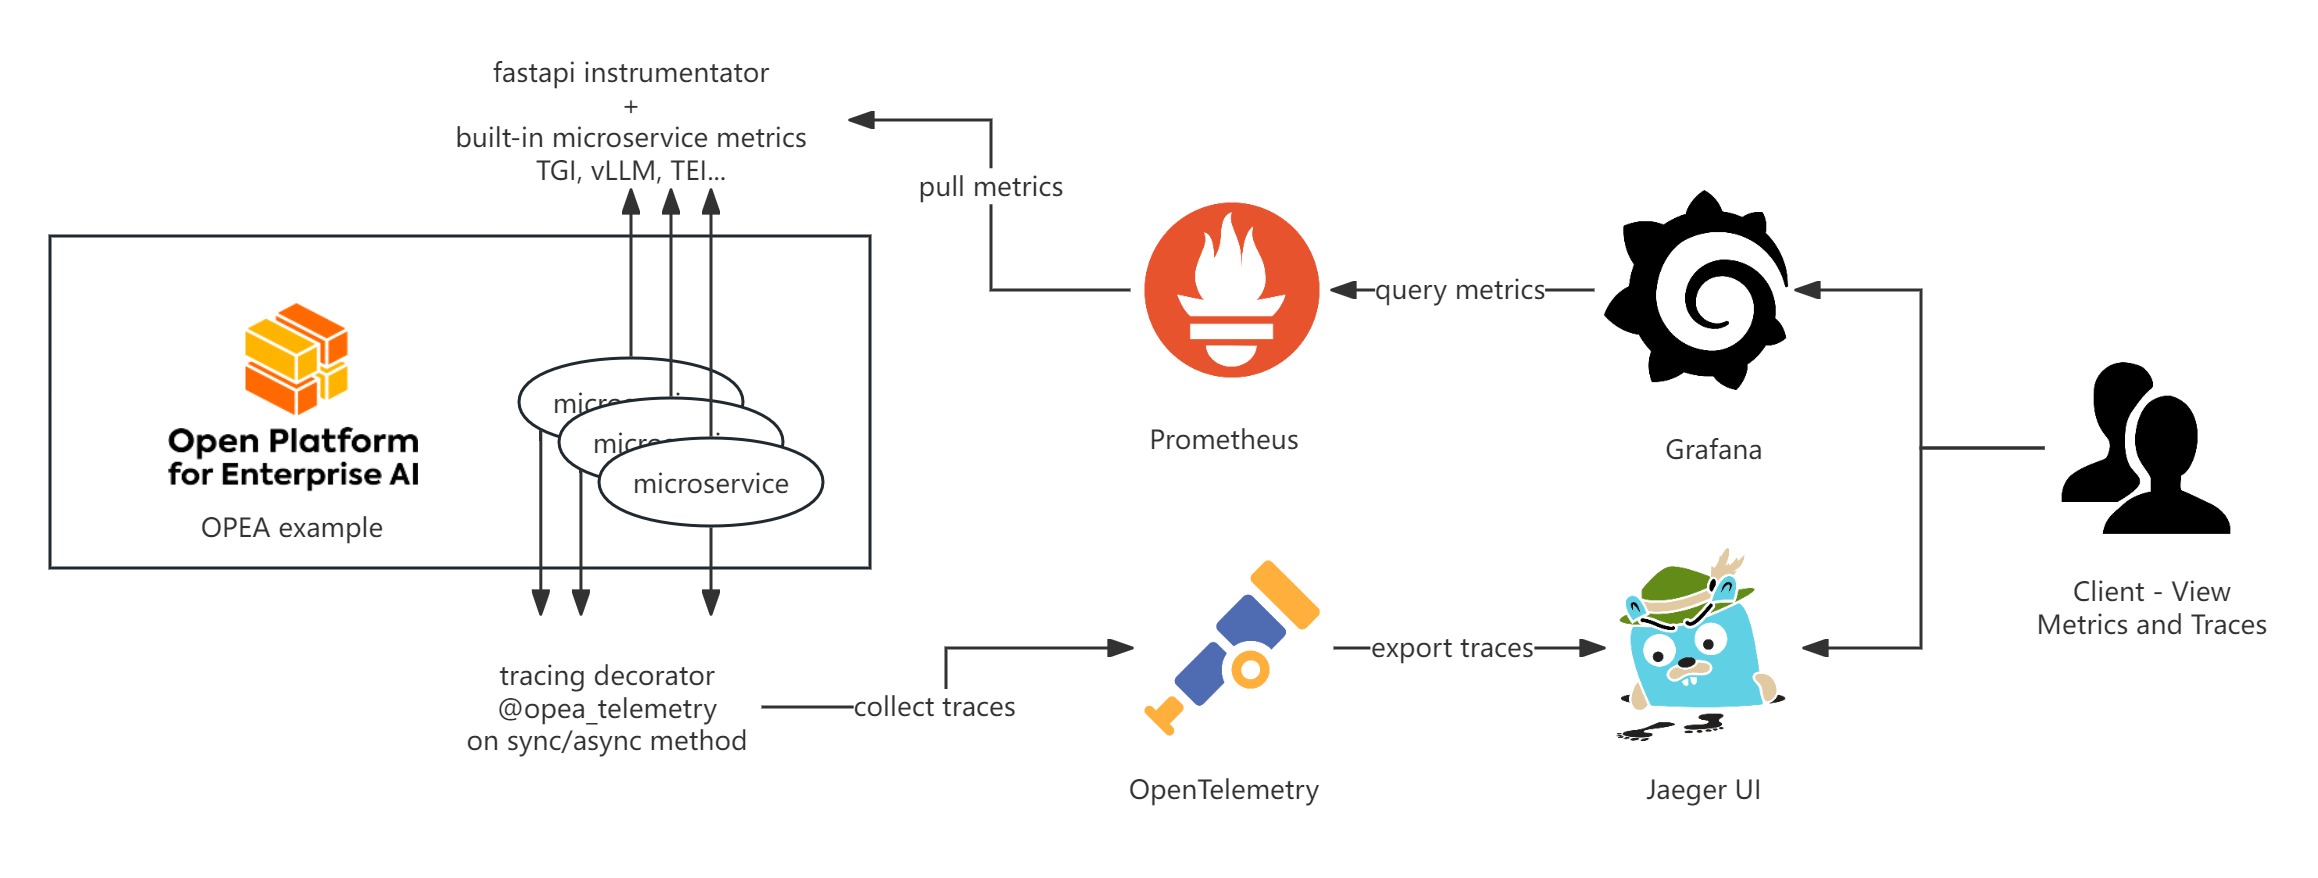
OPEA Comps currently provides telemetry functionalities for metrics and tracing using Prometheus, Grafana, and Jaeger. Here’s a basic introduction to these tools:
Contents:
Metrics
OPEA microservice metrics are exported in Prometheus format under /metrics endpoint.
They come in several categories:
HTTP request metrics are exposed by every OPEA microservice using the prometheus-fastapi-instrumentator
Megaservices export additional metrics for application end-to-end load / performance
Inferencing microservices such as TGI, vLLM, TEI provide their own metrics
They can be fetched e.g. with curl:
curl localhost:{port of your service}/metrics
HTTP metrics
Metrics output looks following:
HELP http_requests_total Total number of requests by method, status and handler.
# TYPE http_requests_total counter
http_requests_total{handler="/metrics",method="GET",status="2xx"} 3.0
http_requests_total{handler="/v1/chatqna",method="POST",status="2xx"} 2.0
...
# HELP http_request_size_bytes Content length of incoming requests by handler. Only value of header is respected. Otherwise ignored. No percentile calculated.
# TYPE http_request_size_bytes summary
http_request_size_bytes_count{handler="/metrics"} 3.0
http_request_size_bytes_sum{handler="/metrics"} 0.0
http_request_size_bytes_count{handler="/v1/chatqna"} 2.0
http_request_size_bytes_sum{handler="/v1/chatqna"} 128.0
...
Most of them are histogram metrics.
Megaservice E2E metrics
Applications’ megaservice ServiceOrchectrator provides following metrics:
megaservice_first_token_latency: time to first token (TTFT)megaservice_inter_token_latency: inter-token latency (ITL ~ TPOT)megaservice_request_latency: whole request E2E latency = TTFT + ITL * tokensmegaservice_request_pending: how many LLM requests are still in progress
Latency ones are histogram metrics i.e. include count, total value and set of value buckets for each item.
They are available only for stream requests using LLM. Pending count accounts for all requests.
Inferencing metrics
For example, you can curl localhost:6006/metrics to retrieve the TEI embedding metrics, and the output should look like follows:
# TYPE te_embed_count counter
te_embed_count 7

# TYPE te_request_success counter
te_request_success{method="batch"} 2

# TYPE te_request_count counter
te_request_count{method="single"} 2
te_request_count{method="batch"} 2

# TYPE te_embed_success counter
te_embed_success 7

# TYPE te_queue_size gauge
te_queue_size 0

# TYPE te_request_inference_duration histogram
te_request_inference_duration_bucket{le="0.000015000000000000002"} 0
te_request_inference_duration_bucket{le="0.000022500000000000005"} 0
te_request_inference_duration_bucket{le="0.00003375000000000001"} 0
Metrics collection
These metrics can be scraped by the Prometheus server into a time-series database and further visualized using Grafana.
Below are some default metrics endpoints for specific microservices:
component |
port |
endpoint |
metircs doc |
|---|---|---|---|
TGI |
80 |
/metrics |
|
milvus |
9091 |
/metrics |
|
vLLM |
18688 |
/metrics |
|
TEI embedding |
6006 |
/metrics |
|
TEI reranking |
8808 |
/metrics |
Statistics
Additionally, GenAIComps microservices provide separate /v1/statistics endpoint, which outputs P50, P99 and average metrics
for response times, and first token latencies, if microservice processes them.
Tracing
OPEA use OpenTelemetry to trace function call stacks. To trace a function, add the @opea_telemetry decorator to either an async or sync function. The call stacks and time span data will be exported by OpenTelemetry. You can use Jaeger UI to visualize this tracing data.
By default, tracing data is exported to http://localhost:4318/v1/traces. This endpoint can be customized by editing the TELEMETRY_ENDPOINT environment variable.
from comps import opea_telemetry


@opea_telemetry
async def your_async_func():
    pass


@opea_telemetry
def your_sync_func():
    pass
Visualization
Visualize metrics
Please refer to OPEA grafana to get the details of Prometheus and Grafana server setup. The Grafana dashboard JSON files are also provided under OPEA grafana to visualize the metrics.
Visualize tracing
Run the following command to start the Jaeger server.
docker run -d --rm \
-e COLLECTOR_ZIPKIN_HOST_PORT=:9411 \
-p 16686:16686 \
-p 4317:4317 \
-p 4318:4318 \
-p 9411:9411 \
jaegertracing/all-in-one:latest
Access the dashboard UI at localhost:16686.