Metrics / visualization add-ons
Table of Contents
Pre-conditions
Monitoring for Helm installed OPEA applications is already working, see Helm monitoring option.
Device metrics for Gaudi HW
To monitor Gaudi hardware metrics, you can use the following steps:
Step 1: Install daemonset
kubectl create -f https://vault.habana.ai/artifactory/gaudi-metric-exporter/yaml/1.16.2/metric-exporter-daemonset.yaml
Step 2: Install metric-exporter
kubectl create -f https://vault.habana.ai/artifactory/gaudi-metric-exporter/yaml/1.16.2/metric-exporter-service.yaml
Step 3: Install service-monitor
kubectl apply -f ./habana/metric-exporter-serviceMonitor.yaml
Step 4: Verify the metrics
# To get the metric endpoints, e.g. to get first endpoint to test
habana_metric_url=`kubectl -n monitoring get ep metric-exporter -o jsonpath="{.subsets[].addresses[0].ip}:{..subsets[].ports[0].port}"`
# Fetch the metrics
curl ${habana_metric_url}/metrics

# you will see the habana metric data  like this:
process_resident_memory_bytes 2.9216768e+07
# HELP process_start_time_seconds Start time of the process since unix epoch in seconds.
# TYPE process_start_time_seconds gauge
process_start_time_seconds 1.71394960963e+09
# HELP process_virtual_memory_bytes Virtual memory size in bytes.
# TYPE process_virtual_memory_bytes gauge
process_virtual_memory_bytes 2.862641152e+09
# HELP process_virtual_memory_max_bytes Maximum amount of virtual memory available in bytes.
# TYPE process_virtual_memory_max_bytes gauge
process_virtual_memory_max_bytes 1.8446744073709552e+19
# HELP promhttp_metric_handler_requests_in_flight Current number of scrapes being served.
# TYPE promhttp_metric_handler_requests_in_flight gauge
promhttp_metric_handler_requests_in_flight 1
# HELP promhttp_metric_handler_requests_total Total number of scrapes by HTTP status code.
# TYPE promhttp_metric_handler_requests_total counter
promhttp_metric_handler_requests_total{code="200"} 125
promhttp_metric_handler_requests_total{code="500"} 0
promhttp_metric_handler_requests_total{code="503"} 0
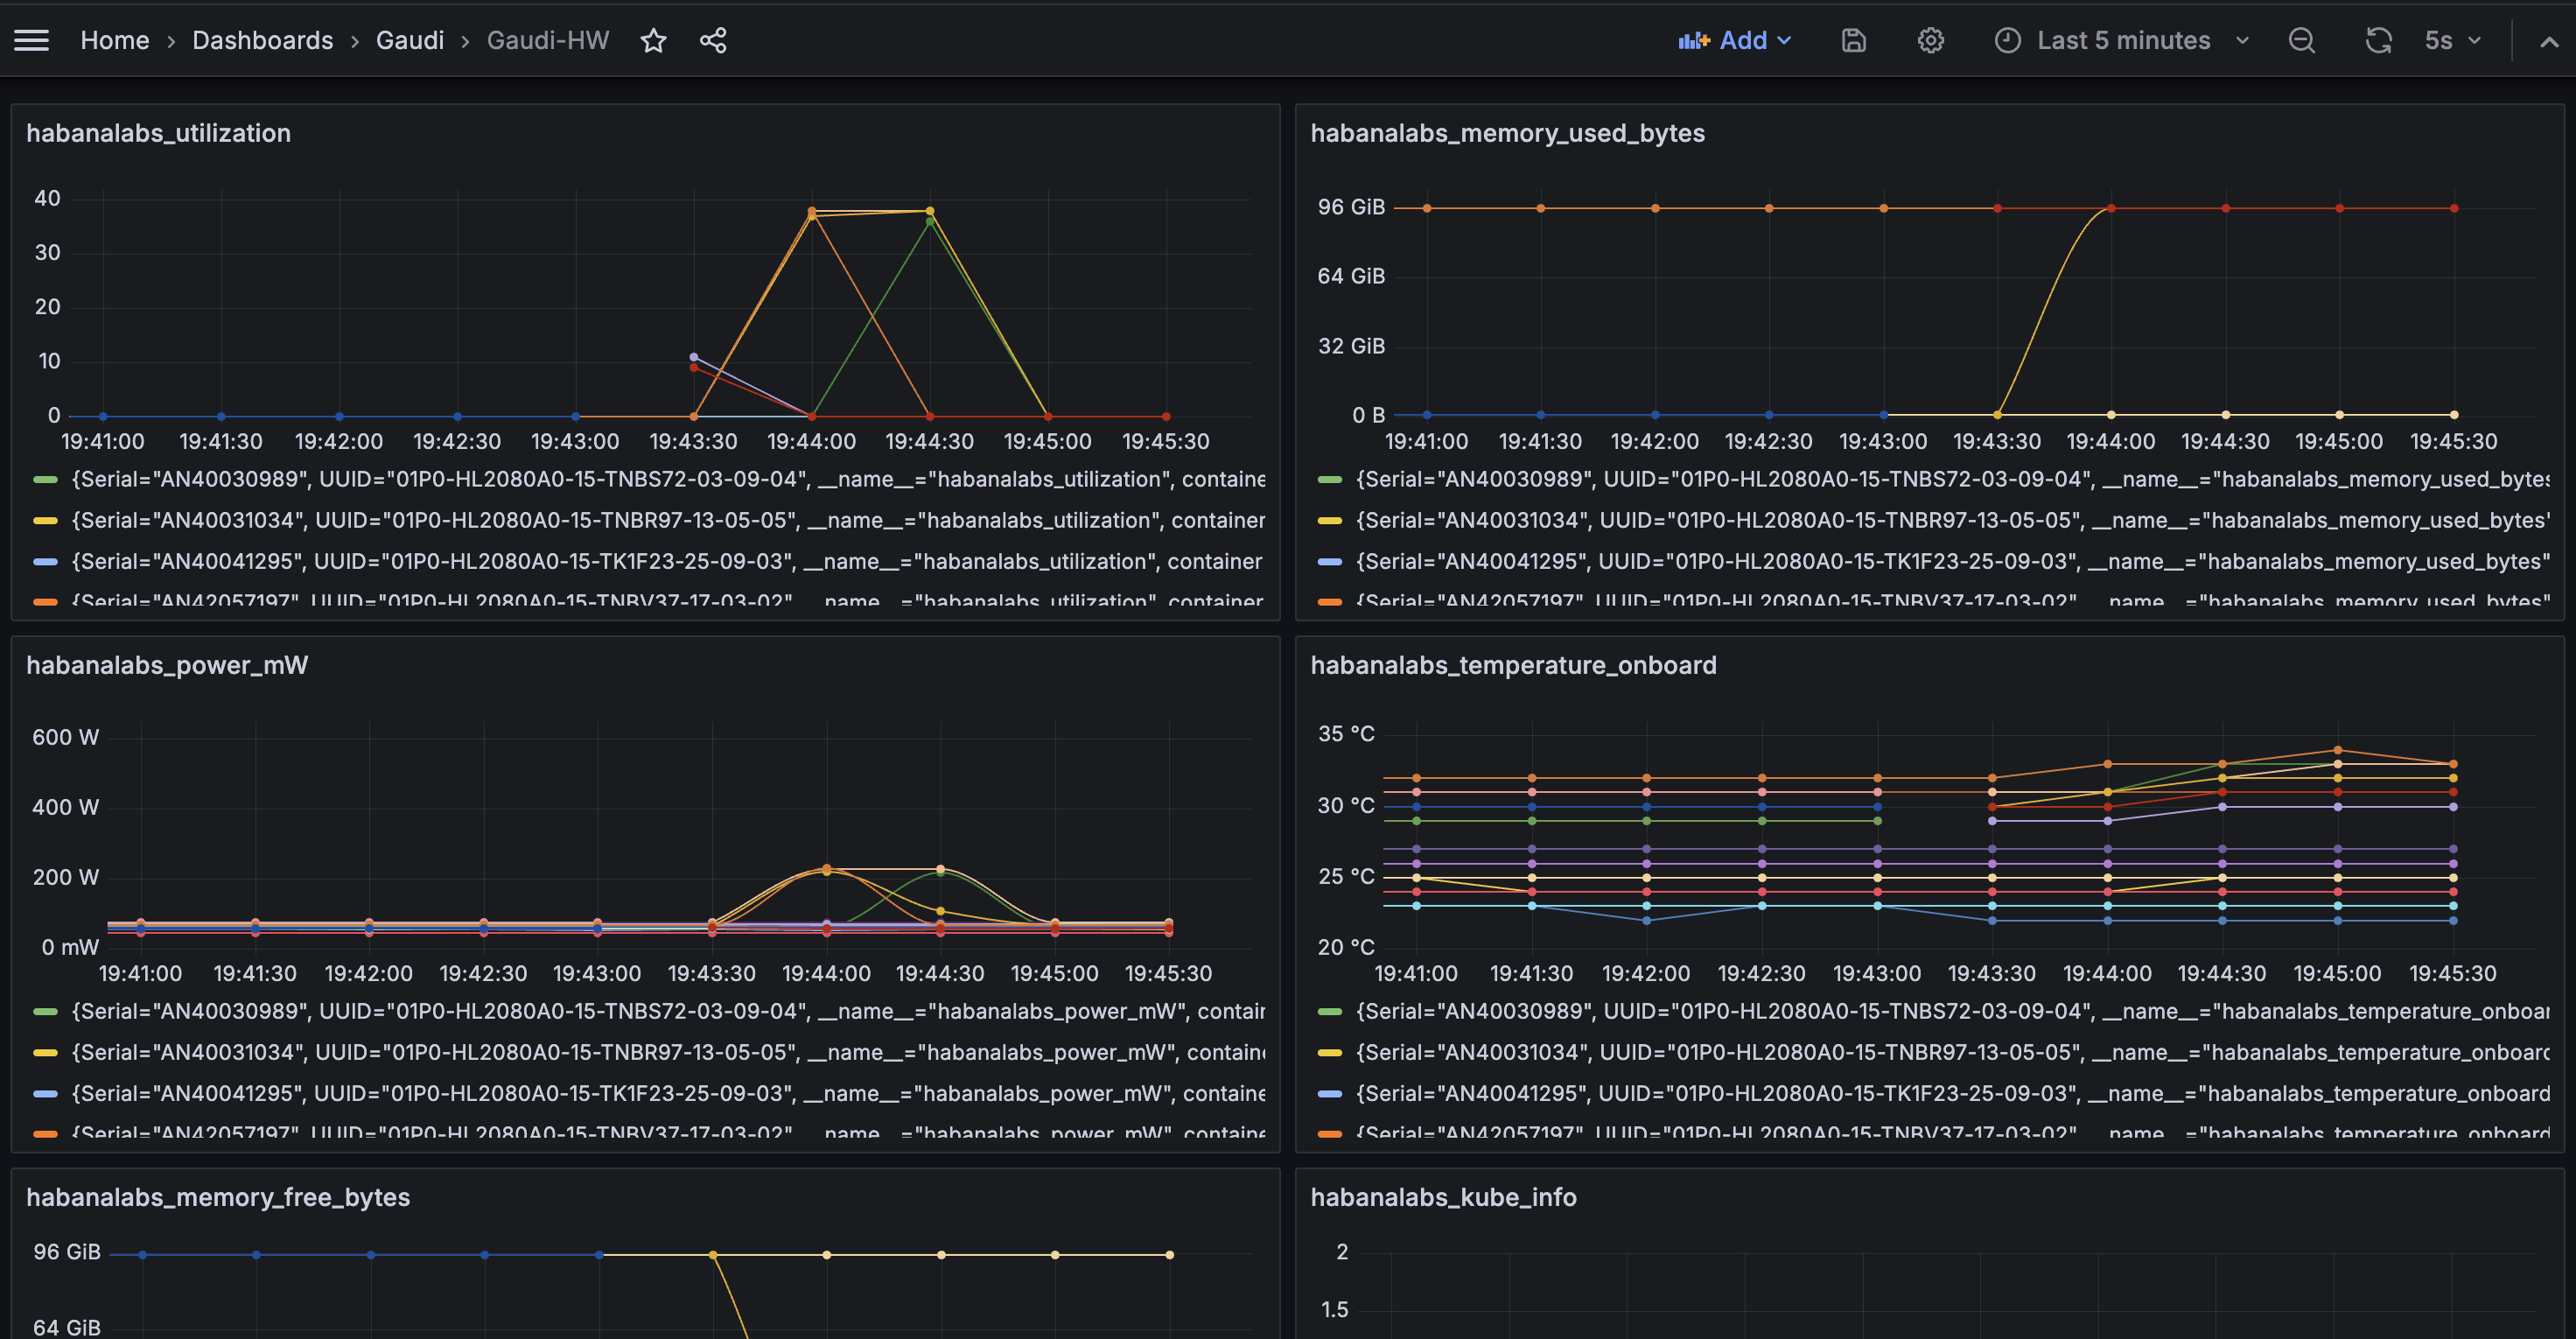
Step 5: Import the dashboard into Grafana
Import the Dashboard-Gaudi-HW.json file into Grafana
Extra metrics for OPEA applications
Here are few Grafana dashboards for monitoring additional aspects of OPEA applications:
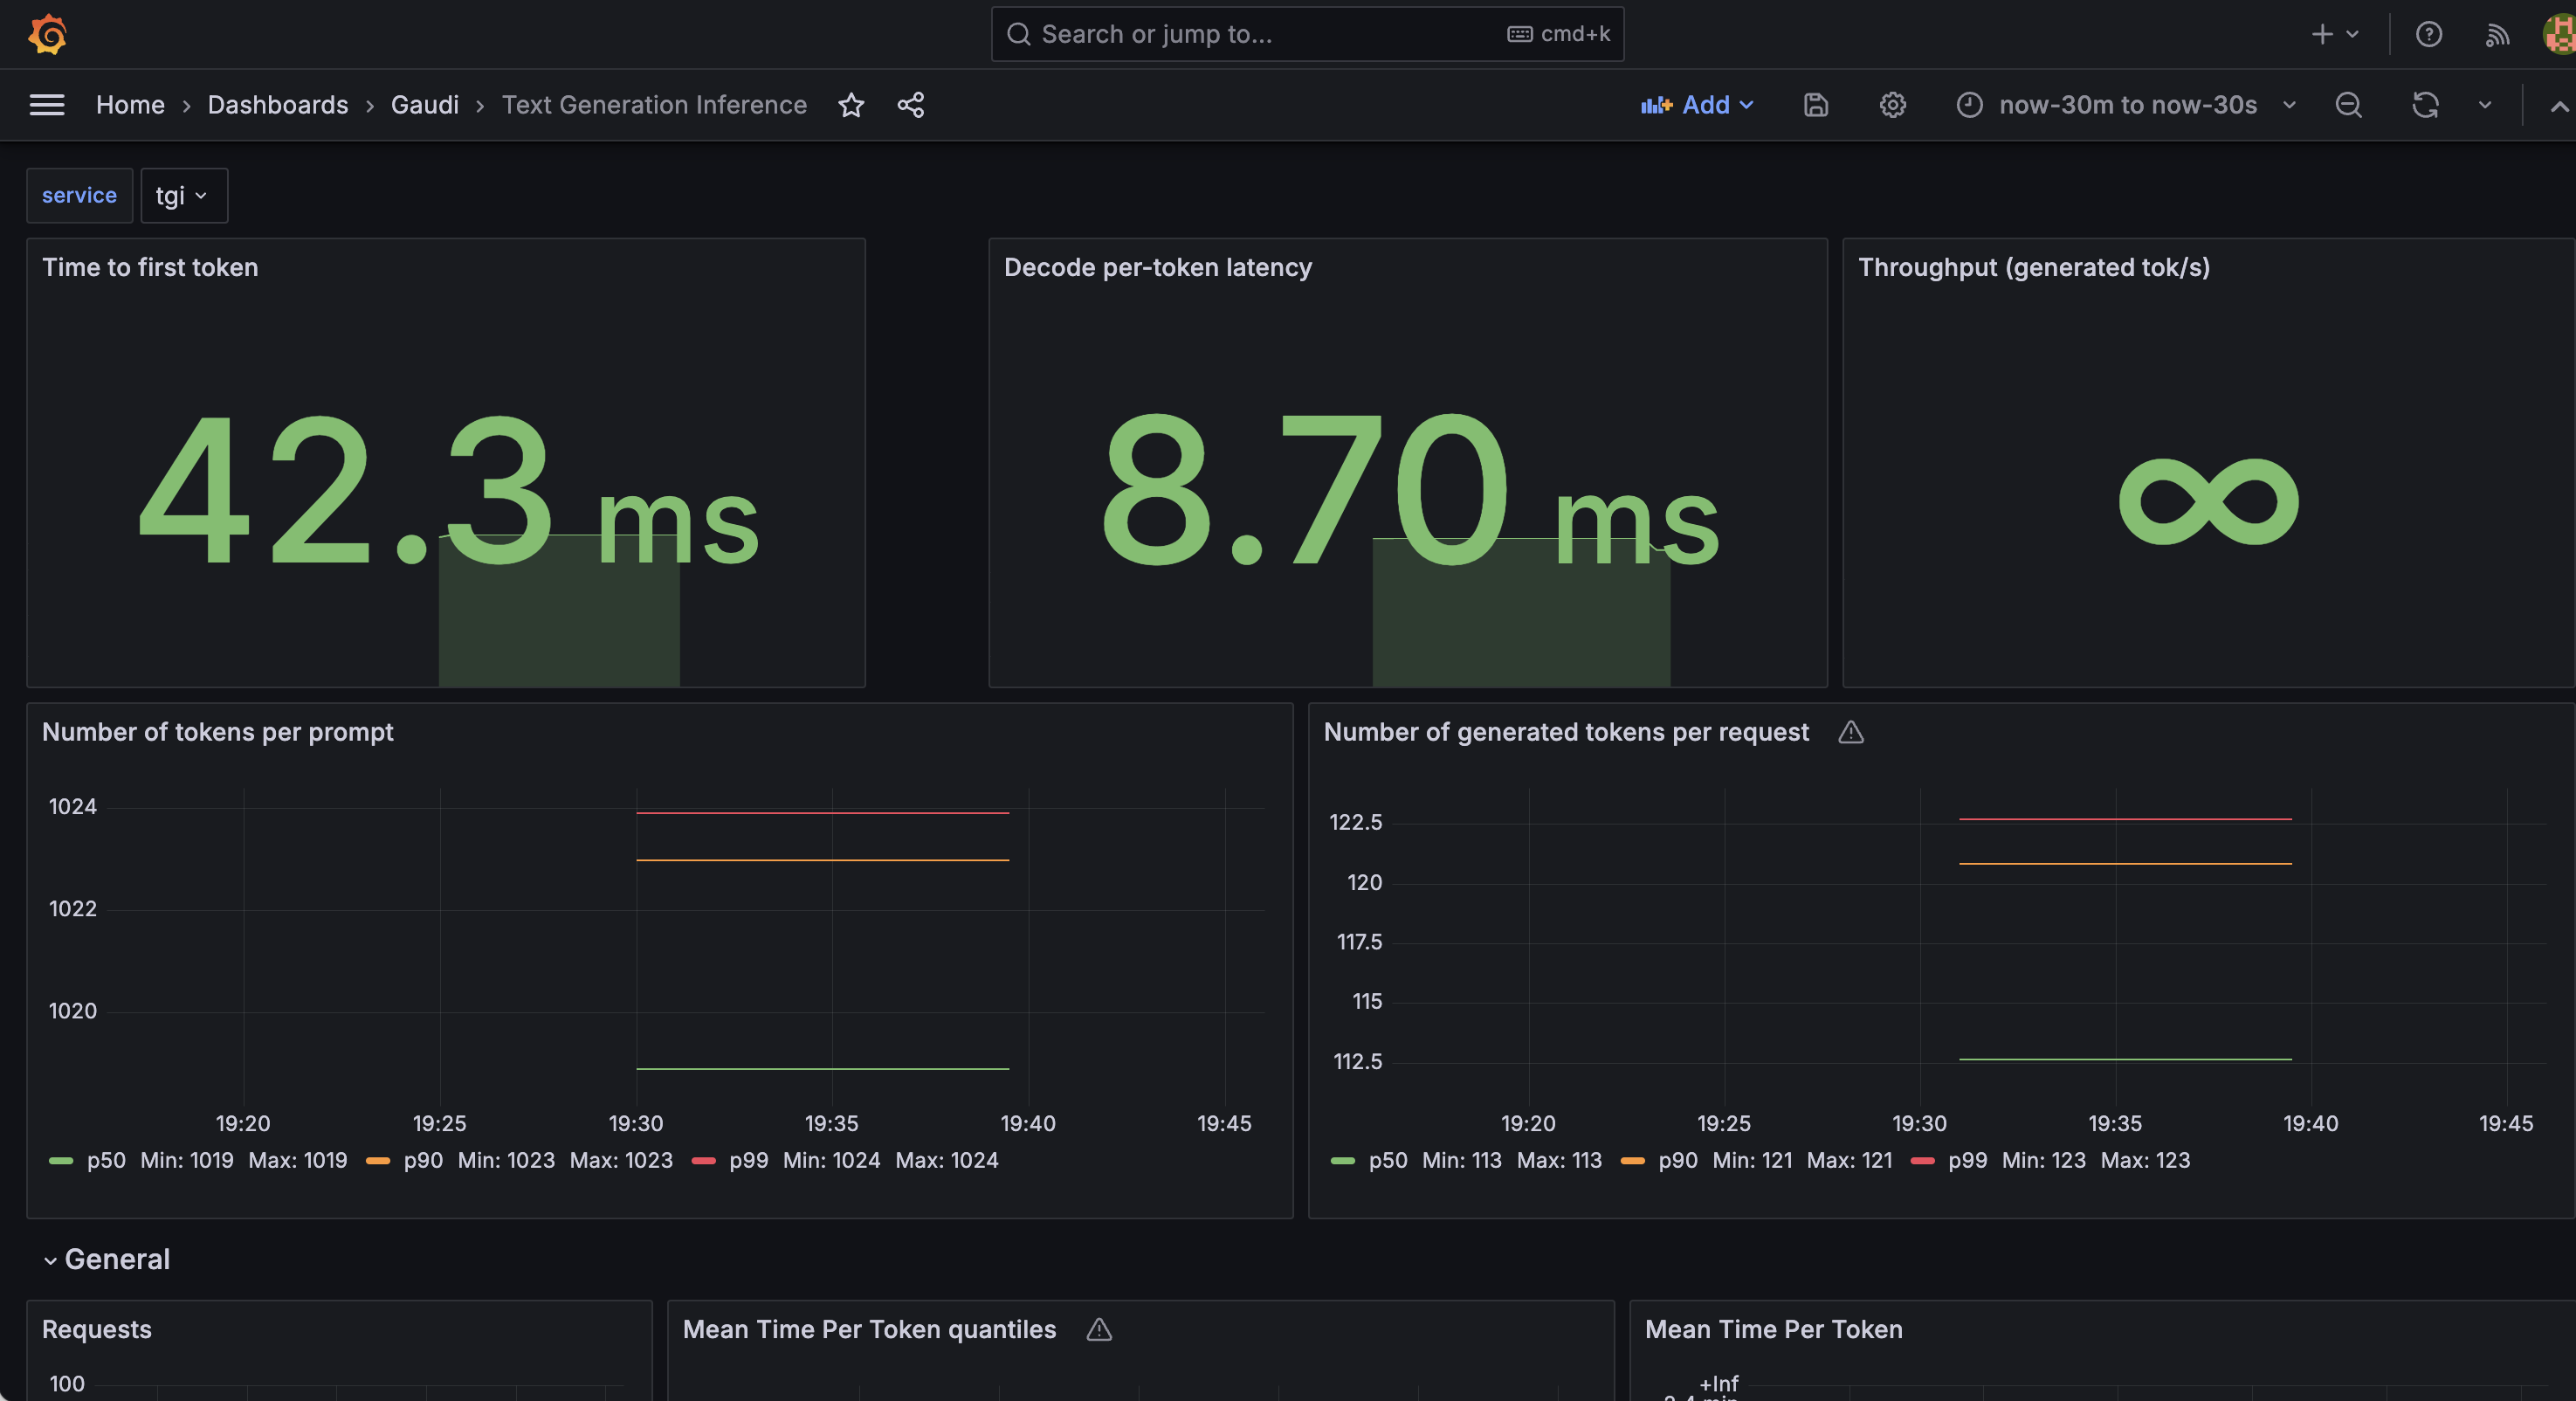
queue_size_embedding_rerank_tgi.json: queue size of TGI-gaudi, TEI-Embedding, TEI-rerankingtgi_grafana.json:tgi-gauditext generation inferencing service utilization
Which can be imported to Grafana.
NOTE: Services provide metrics only after they have processed at least one query, before that dashboards can be empty!
CPU mmetrics from PCM
To monitor PCM (Intel® Performance Counter Monitor) metrics, you can use the following steps:
Step 1: Install PCM
Please refer to this repo to install Intel® PCM
Step 2: Modify & Install pcm-service
modify the pcm/pcm-service.yaml file to set the addresses
kubectl apply -f pcm/pcm-service.yaml
Step 3: Install PCM serviceMonitor
kubectl apply -f pcm/pcm-serviceMonitor.yaml
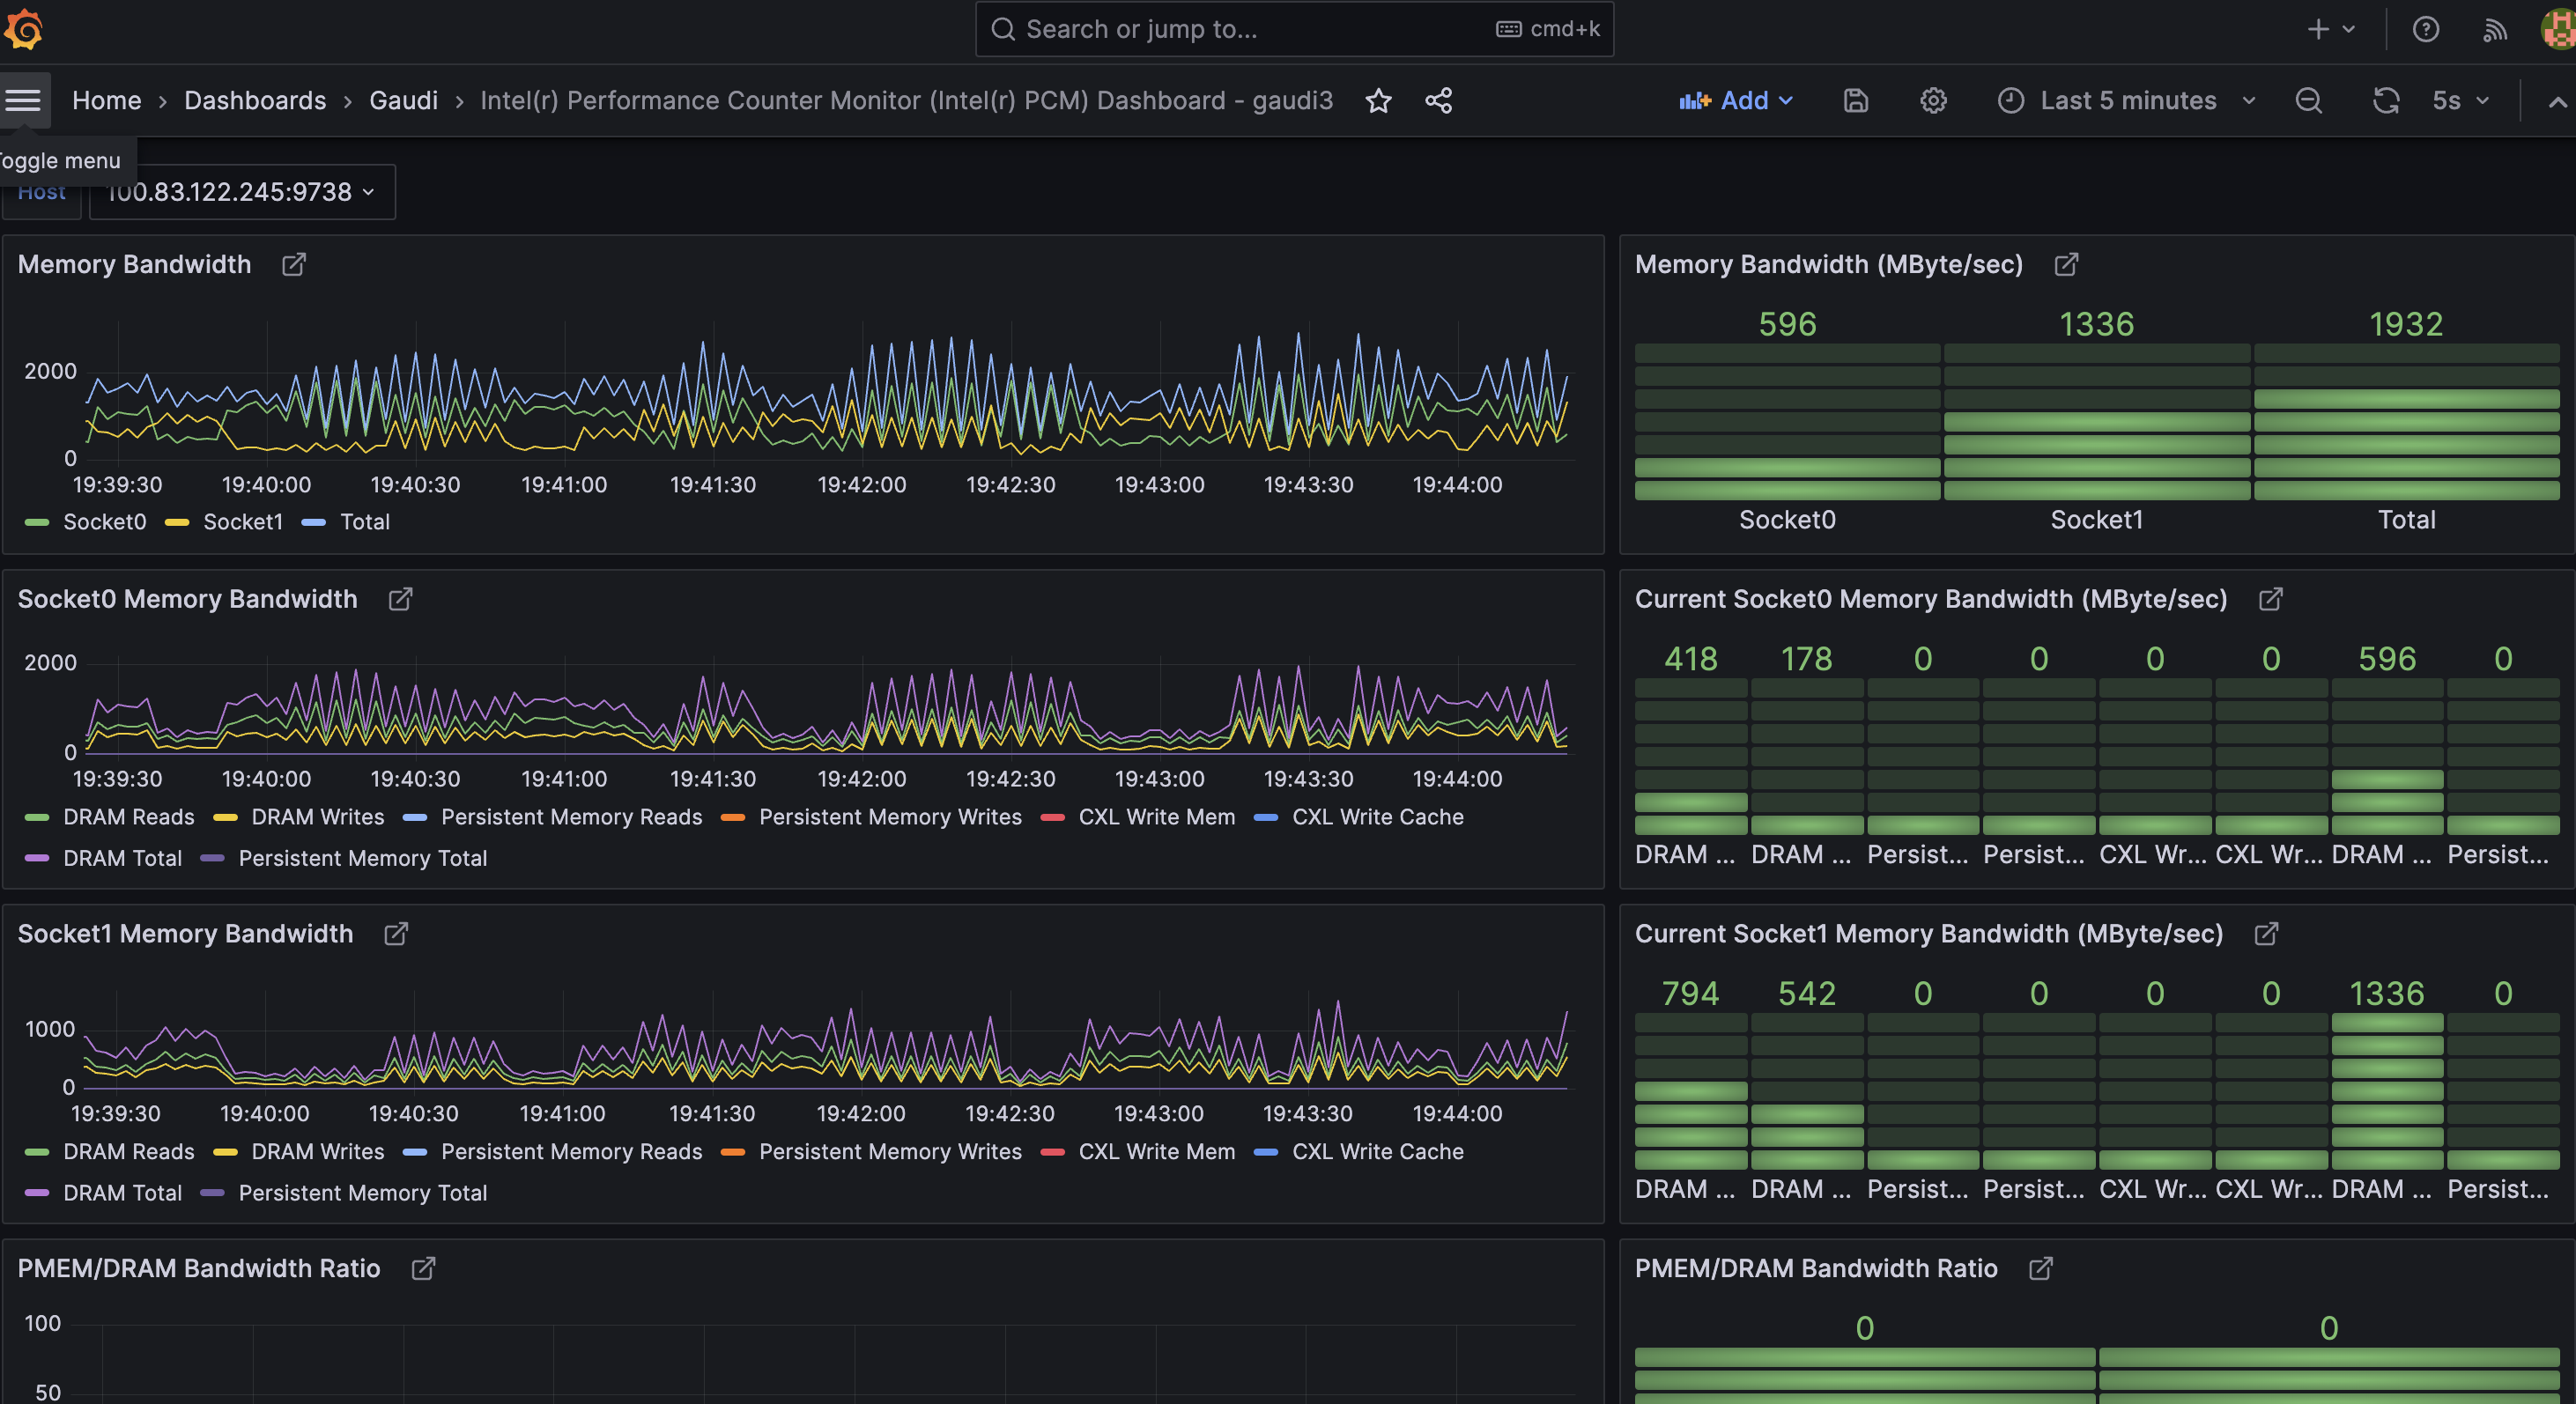
Step 4: Install the PCM dashboard
Import the pcm-dashboard.json file into the Grafana
Importing dashboards to Grafana
You can either:
Import them manually to Grafana,
Use
update-dashboards.shscript to add them to Kubernetes as (more persistent) Grafana dashboardconfigMapsScript uses
$USER-<file name>as dashboardconfigMapnames, and overwrites any pre-existingconfigMapwith the same name
Or create your own dashboards based on them
When dashboard is imported to Grafana, you can directly save changes to it, but such dashboards go away if Grafana is removed / re-installed. When dashboard is in configMap, Grafana saves its changes to a (selected) file, but you need to re-apply those files to Kubernetes with the script, for your changes to be there when that Grafana dashboard page is reloaded in browser.
Gotchas for dashboard configMap script usage:
If you change dashboard file name, you need to change also its ‘uid’ field (at end of the file), otherwise Grafana will see multiple
configMaps for the same dashboard IDIf there’s no
uidspecified for the dashboard, Grafana will generate one onconfigMapload. Meaning that dashboard ID, and Grafana URL to it, will change on every reloadScript assumes default Prometheus / Grafana install (
monitoringnamespace,grafana_dasboard=1label identifying dashboardconfigMaps)
More dashboards
GenAIEval repository includes additional dashboards.