CodeTrans Docker Image Build
Table of Contents
Build MegaService Docker Image
To construct the Megaservice of CodeTrans, the GenAIExamples repository is utilized. Build Megaservice Docker image via command below:
git clone https://github.com/opea-project/GenAIExamples.git
cd GenAIExamples/CodeTrans
docker build --no-cache -t opea/codetrans:latest --build-arg https_proxy=$https_proxy --build-arg http_proxy=$http_proxy -f Dockerfile .
Build UI Docker Image
Build frontend Docker image via below command:
cd GenAIExamples/CodeTrans/ui
docker build -t opea/codetrans-ui:latest --build-arg https_proxy=$https_proxy --build-arg http_proxy=$http_proxy -f ./docker/Dockerfile .
Generate a HuggingFace Access Token
Some HuggingFace resources, such as some models, are only accessible if the developer have an access token. In the absence of a HuggingFace access token, the developer can create one by first creating an account by following the steps provided at HuggingFace and then generating a user access token.
Troubleshooting
If you get errors like “Access Denied”, validate micro service first. A simple example:
http_proxy=""
curl http://${host_ip}:8008/generate \
  -X POST \
  -d '{"inputs":"    ### System: Please translate the following Golang codes into  Python codes.    ### Original codes:    '\'''\'''\''Golang    \npackage main\n\nimport \"fmt\"\nfunc main() {\n    fmt.Println(\"Hello, World!\");\n    '\'''\'''\''    ### Translated codes:","parameters":{"max_tokens":17, "do_sample": true}}' \
  -H 'Content-Type: application/json'
(Docker only) If all microservices work well, check the port ${host_ip}:7777, the port may be allocated by other users, you can modify the
compose.yaml.(Docker only) If you get errors like “The container name is in use”, change container name in
compose.yaml.
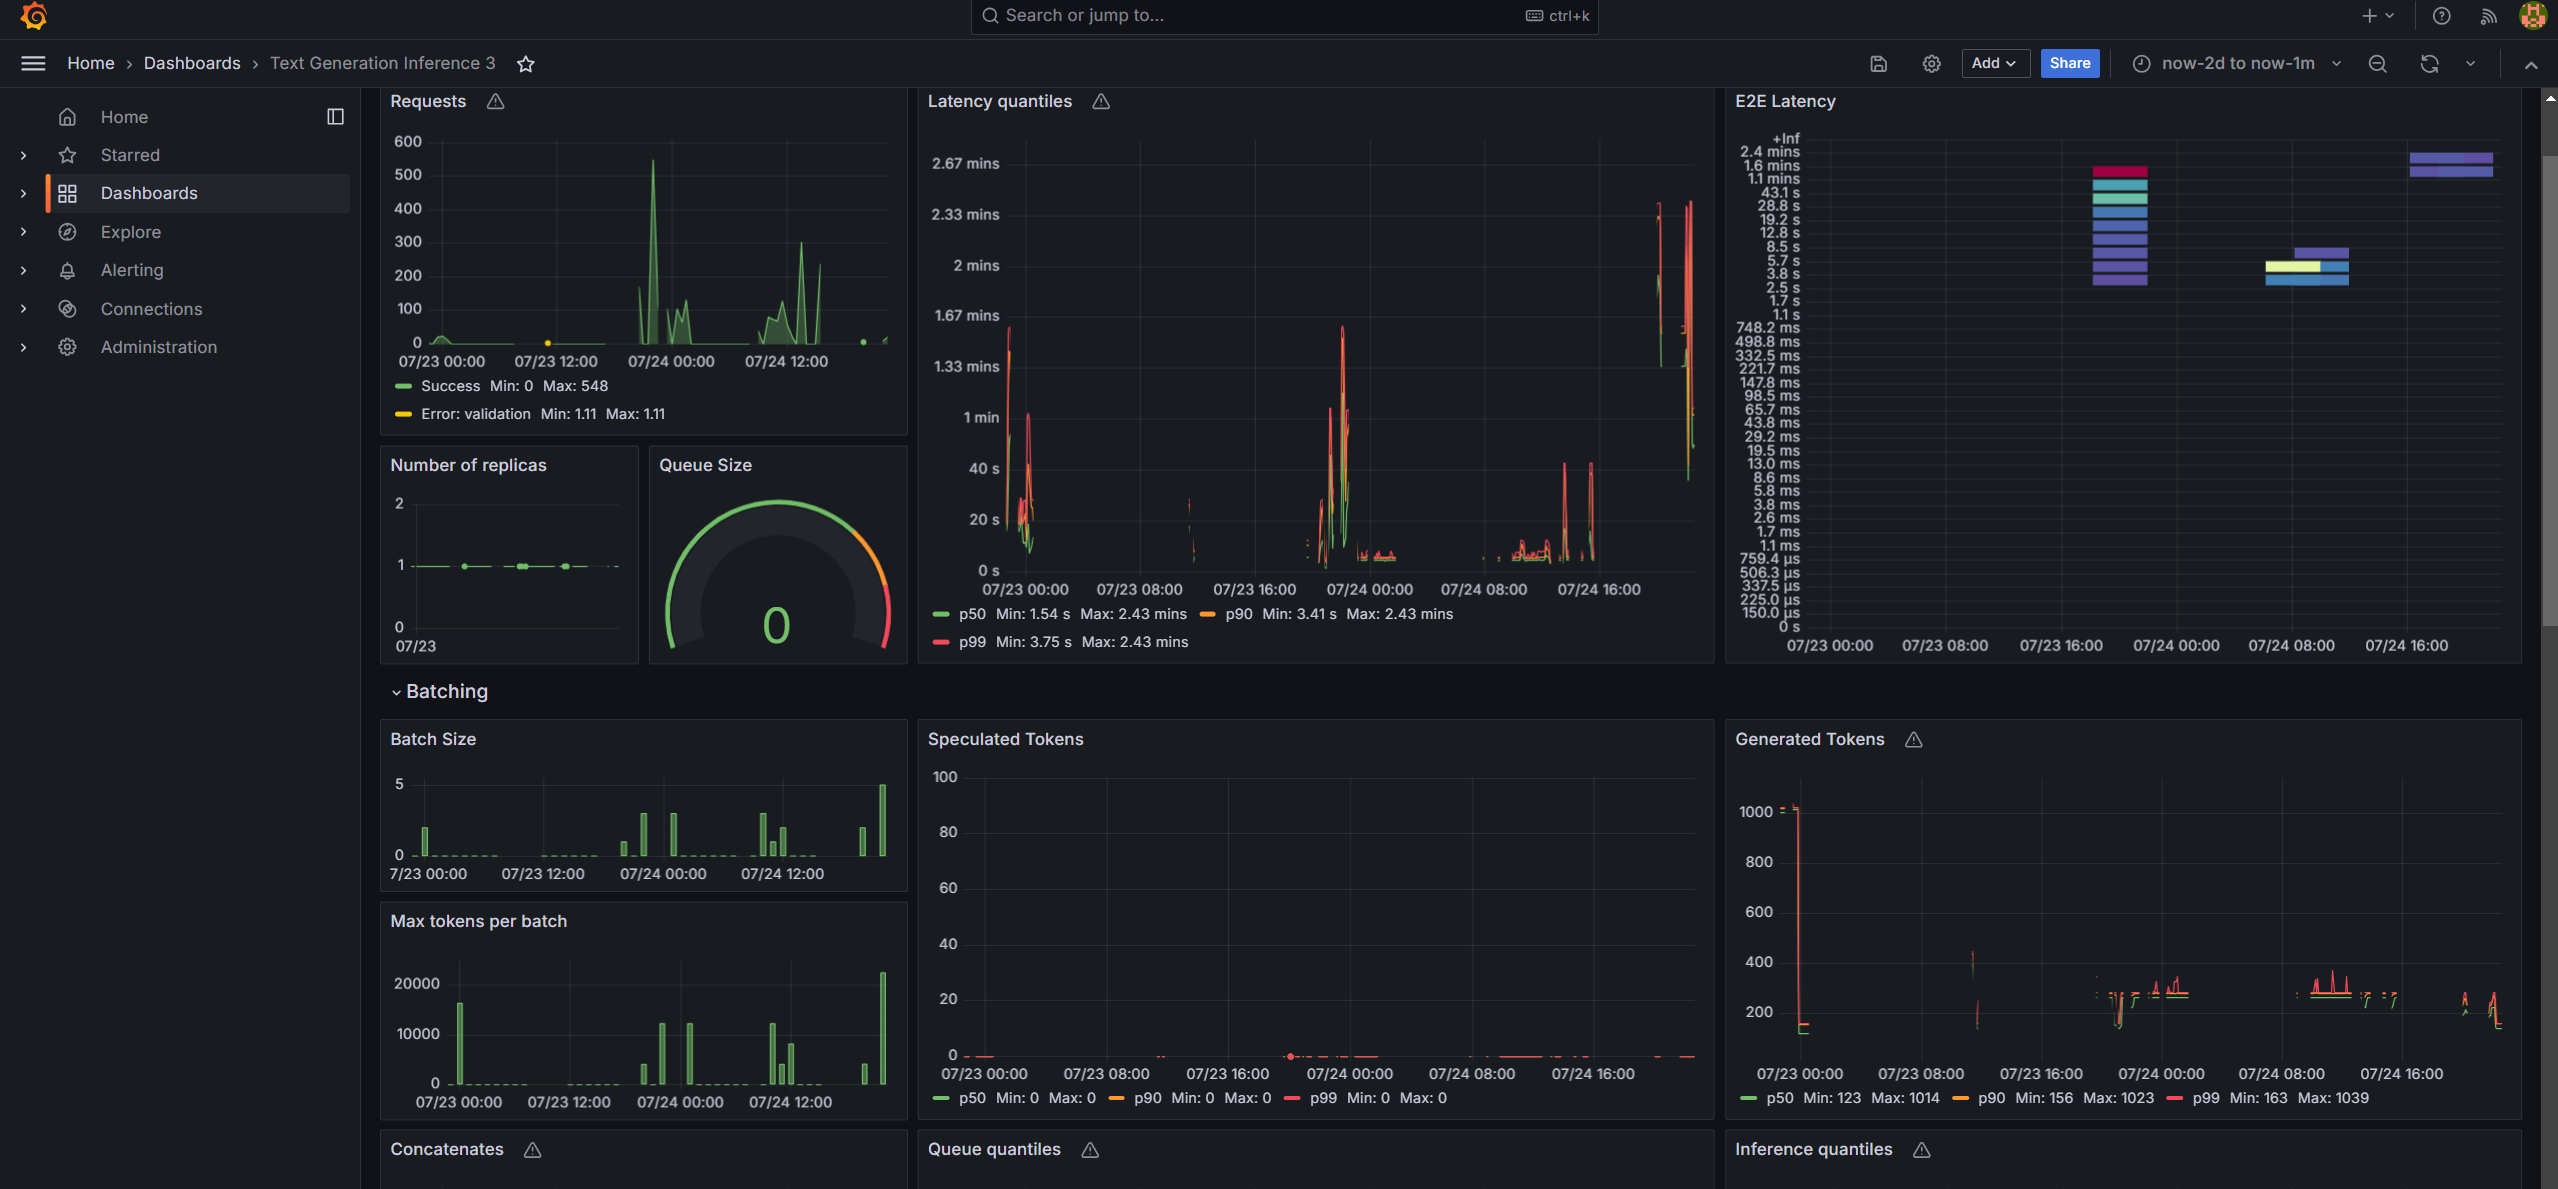
Monitoring OPEA Services with Prometheus and Grafana Dashboard
OPEA microservice deployment can easily be monitored through Grafana dashboards using data collected via Prometheus. Follow the README to setup Prometheus and Grafana servers and import dashboards to monitor the OPEA services.
Tracing with OpenTelemetry and Jaeger
NOTE: This feature is disabled by default. Please use the compose.telemetry.yaml file to enable this feature.
OPEA microservice and TGI/TEI serving can easily be traced through Jaeger dashboards in conjunction with OpenTelemetry Tracing feature. Follow the README to trace additional functions if needed.
Tracing data is exported to http://{EXTERNAL_IP}:4318/v1/traces via Jaeger. Users could also get the external IP via below command.
ip route get 8.8.8.8 | grep -oP 'src \K[^ ]+'
Access the Jaeger dashboard UI at http://{EXTERNAL_IP}:16686
For TGI serving on Gaudi, users could see different services like opea, TEI and TGI.
Here is a screenshot for one tracing of TGI serving request.
There are also OPEA related tracings. Users could understand the time breakdown of each service request by looking into each opea:schedule operation.
There could be asynchronous function such as llm/MicroService_asyn_generate and user needs to check the trace of the asynchronous function in another operation like
opea:llm_generate_stream.