Observability for OPEA Workloads in Kubernetes
Table of Contents
Introduction
Helm chart monitoring option enables observability support for the OPEA workloads;
Prometheus metrics for the service components,
and Grafana visualization for them.
Scaling the services automatically based on their usage with HPA also relies on these metrics.
Metrics / visualization add-ons explains how to install additional monitoring for node and device metrics, and Grafana for visualizing those metrics.
Pre-conditions
Prometheus + Grafana install
If cluster does not run Prometheus operator yet, it SHOULD be be installed before enabling monitoring, e.g. by using a Helm chart for it: https://github.com/prometheus-community/helm-charts/tree/main/charts/kube-prometheus-stack
To install (older 55.x version) of Prometheus & Grafana:
$ helm repo add prometheus-community https://prometheus-community.github.io/helm-charts
$ helm repo update
$ prom_ns=monitoring  # namespace for Prometheus
$ kubectl create ns $prom_ns
$ helm install prometheus-stack prometheus-community/kube-prometheus-stack --version 55.5.2 -n $prom_ns
OPEA Helm options
If Prometheus & Grafana are installed under some other release name than prometheus-stack,
provide that as global.prometheusRelease value for the OPEA service Helm install,
or in its values.yaml file. Otherwise Prometheus ignores the installed
serviceMonitor objects.
Install
Monitoring support + Grafana access
Install (e.g. ChatQnA) Helm chart with --set global.monitoring=true option.
Use port-forward to access Grafana
kubectl port-forward service/grafana 3000:80
Open your browser and navigate to http://localhost:3000. Use “admin/prom-operator” as the username and the password to login.
Dashboards
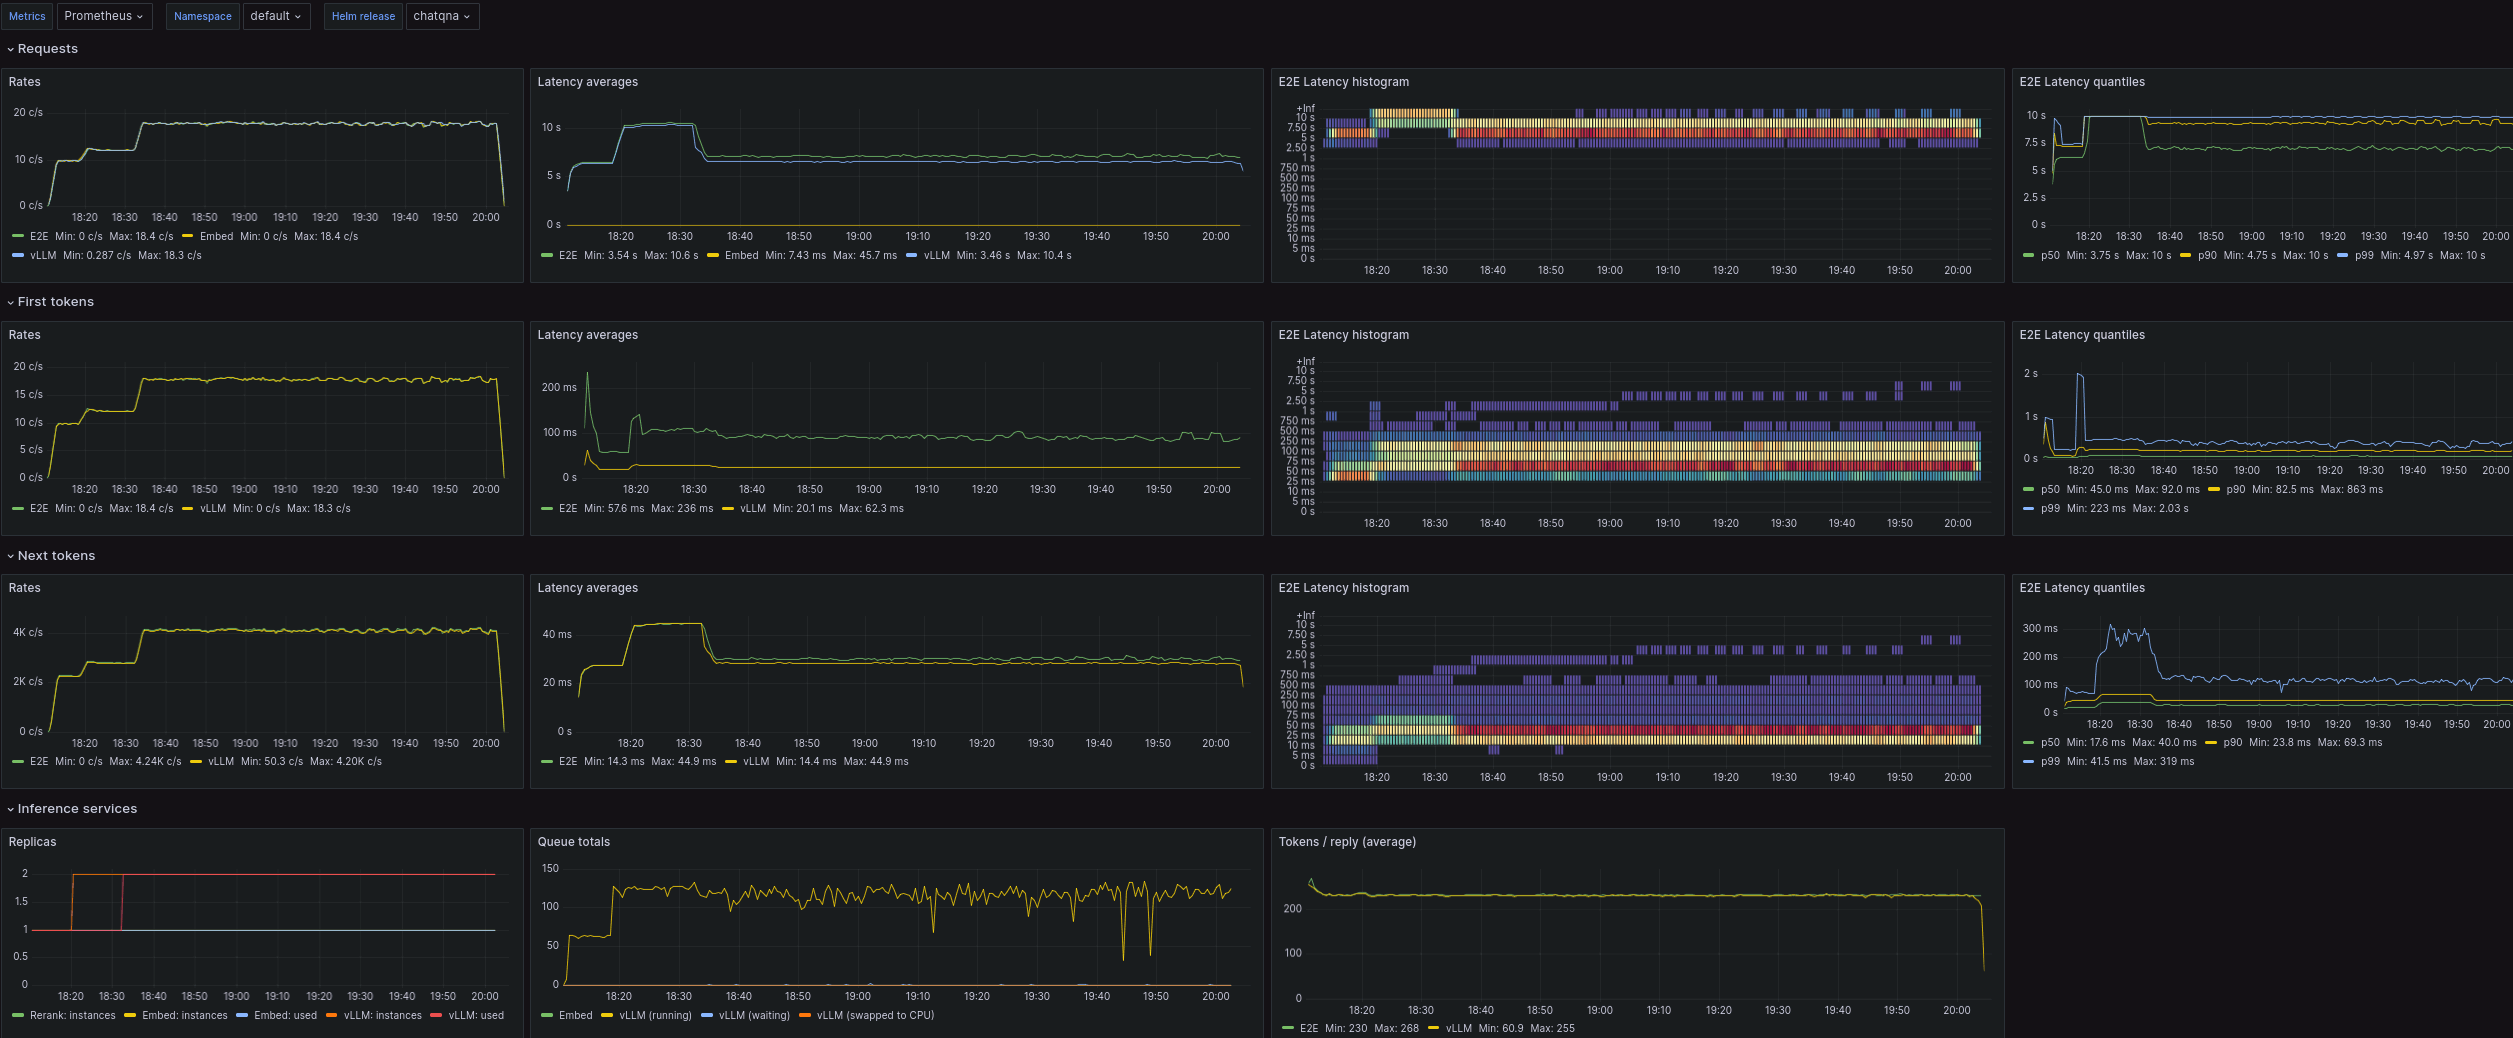
Currently, when monitoring option is enabled for ChatQnA and DocSum
Helm charts, also OPEA application monitoring dashboard is installed:
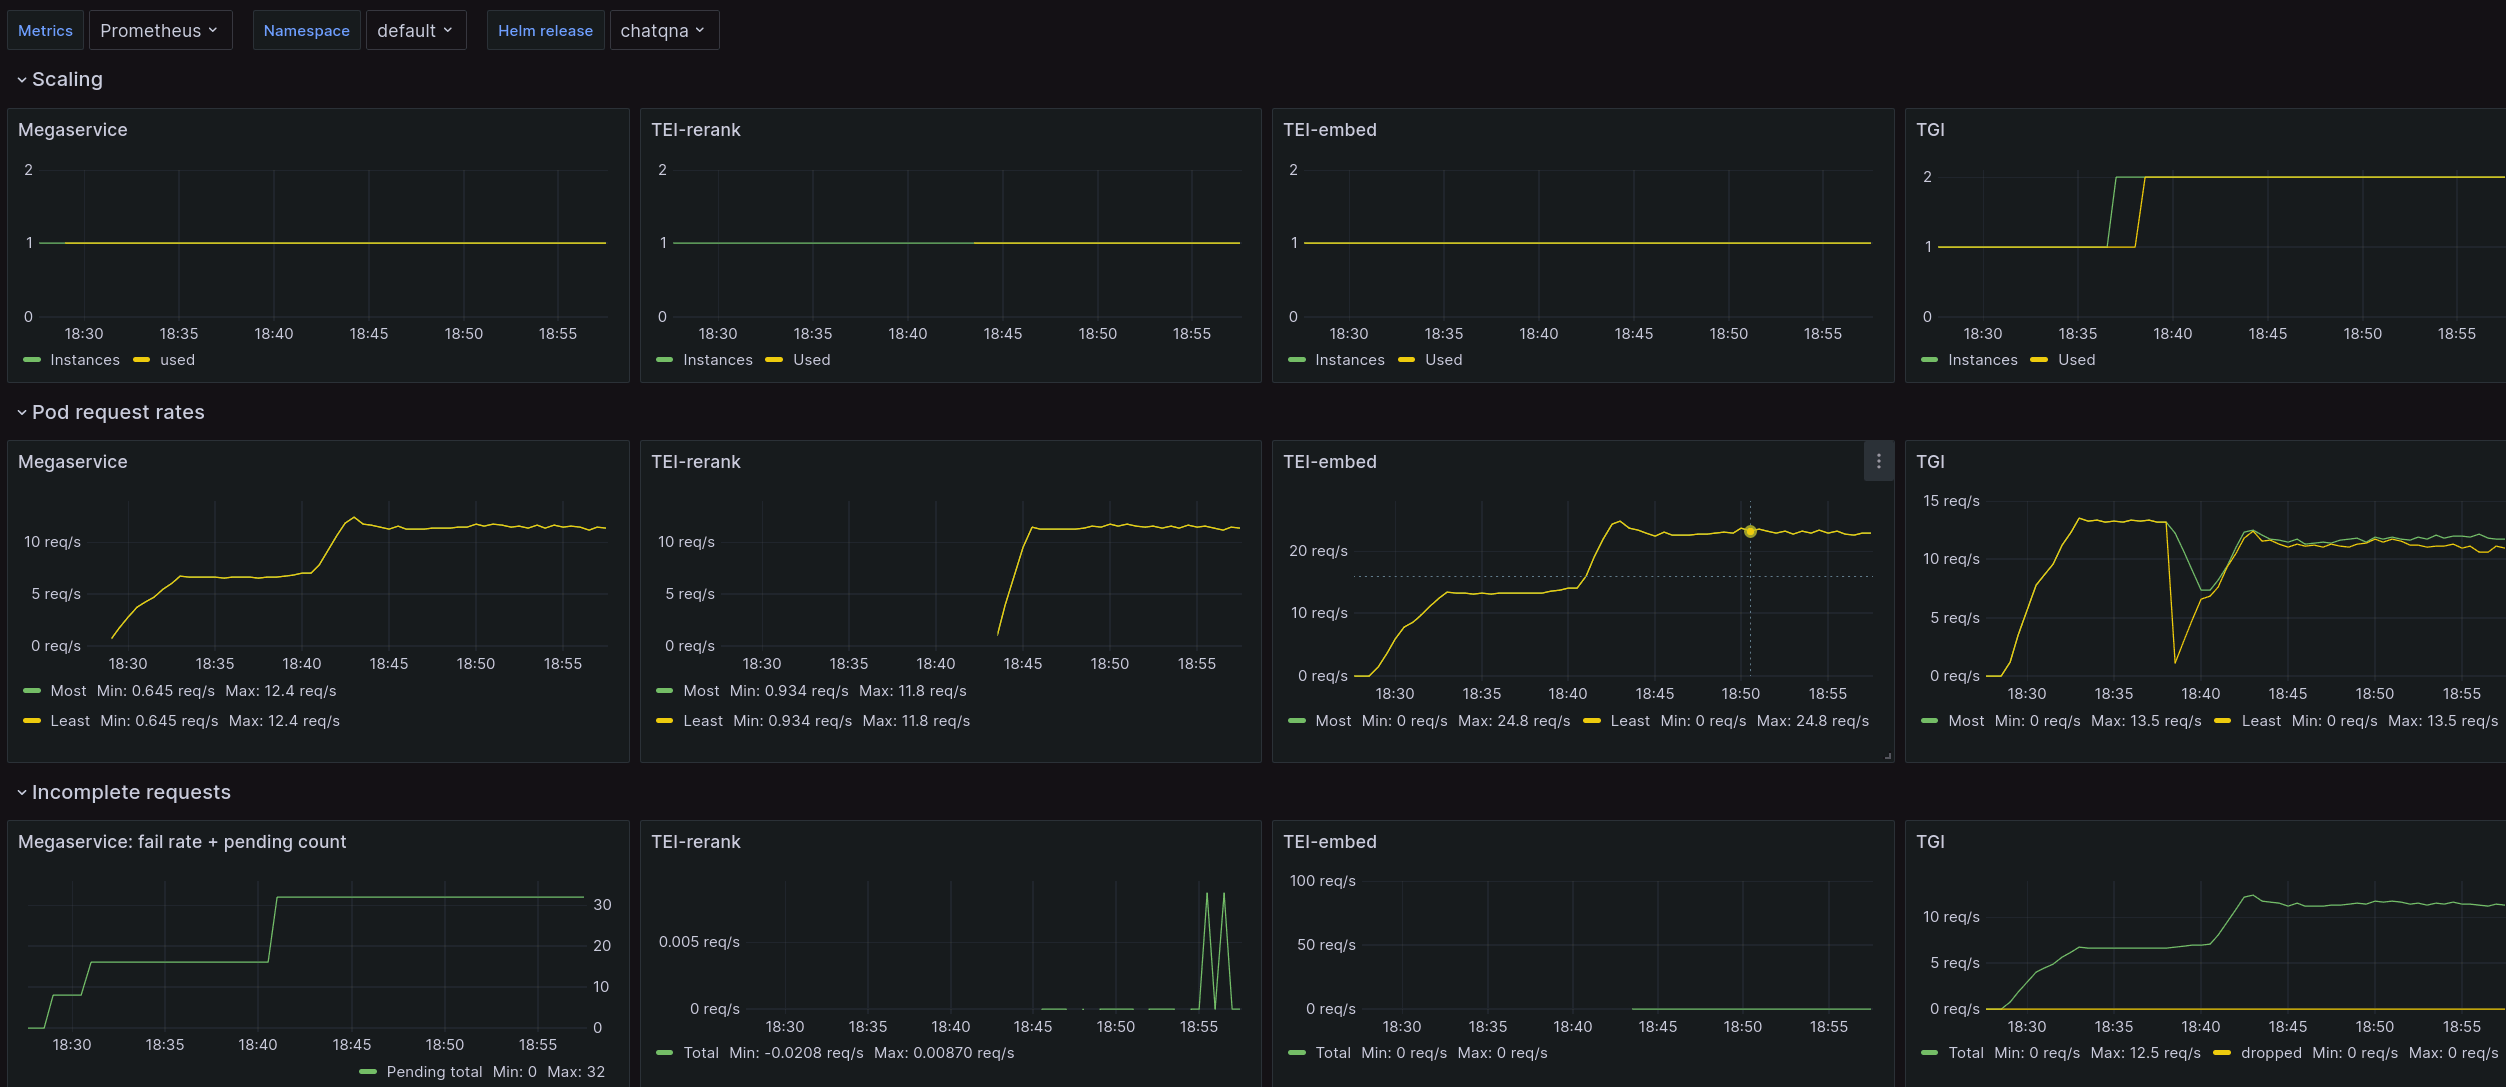
When HPA scaling is enabled, additional application scaling dashboard is installed:
For other applications, if they were installed with monitoring
option enabled, dashboard(s) for monitoring them can be installed
afterwards, with:
$ helm install dashboards dashboards/ --set global.monitoring=true
NOTE: dashboards will list available applications and their metrics only after they’ve processed their first token, because related metrics are not available before that!
Verify
Check installed Prometheus service names:
$ prom_ns=monitoring  # Prometheus namespace
$ kubectl -n $prom_ns get svc
(Object names depend on whether Prometheus was installed from manifests, or Helm, and the release name given for its Helm install.)
Use service name matching your Prometheus installation:
$ prom_svc=prometheus-stack-kube-prom-prometheus # Metrics service
Verify Prometheus found metric endpoints for chart services, i.e. last number on curl output is non-zero:
$ chart=chatqna # OPEA chart release name
$ prom_url=http://$(kubectl -n $prom_ns get -o jsonpath="{.spec.clusterIP}:{.spec.ports[0].port}" svc/$prom_svc)
$ curl --no-progress-meter $prom_url/metrics | grep scrape_pool_targets.*$chart
Then check that Prometheus metrics from a relevant LLM inferencing service are available.
For vLLM:
$ curl --no-progress-meter $prom_url/api/v1/query? \
  --data-urlencode 'query=vllm:cache_config_info{service="'$chart'-vllm"}' | jq
Or TGI:
$ curl --no-progress-meter $prom_url/api/v1/query? \
  --data-urlencode 'query=tgi_queue_size{service="'$chart'-tgi"}' | jq
NOTE: inferencing services provide metrics only after they’ve processed their first request. And reranking service only after query context data has been uploaded!