ChatQnA
Overview
Chatbots are a widely adopted use case for leveraging the powerful chat and reasoning capabilities of large language models (LLMs). The ChatQnA example provides the starting point for developers to begin working in the GenAI space. Consider it the “hello world” of GenAI applications and can be leveraged for solutions across wide enterprise verticals, both internally and externally.
Purpose
The ChatQnA example uses retrieval augmented generation (RAG) architecture, which is quickly becoming the industry standard for chatbot development. It combines the benefits of a knowledge base (via a vector store) and generative models to reduce hallucinations, maintain up-to-date information, and leverage domain-specific knowledge.
RAG bridges the knowledge gap by dynamically fetching relevant information from external sources, ensuring that responses generated remain factual and current. The core of this architecture are vector databases, which are instrumental in enabling efficient and semantic retrieval of information. These databases store data as vectors, allowing RAG to swiftly access the most pertinent documents or data points based on semantic similarity.
Central to the RAG architecture is the use of a generative model, which is responsible for generating responses to user queries. The generative model is trained on a large corpus of customized and relevant text data and is capable of generating human-like responses. Developers can easily swap out the generative model or vector database with their own custom models or databases. This allows developers to build chatbots that are tailored to their specific use cases and requirements. By combining the generative model with the vector database, RAG can provide accurate and contextually relevant responses specific to users’ queries.
The ChatQnA example is designed to be a simple, yet powerful, demonstration of the RAG architecture. It is a great starting point for developers looking to build chatbots that can provide accurate and up-to-date information to users.
To facilitate sharing of individual services across multiple GenAI applications, use the GenAI Microservices Connector (GMC) to deploy the application. Apart from service sharing , it also supports specifying sequential, parallel, and alternative steps in a GenAI pipeline. In so doing, it supports dynamic switching between models used in any stage of a GenAI pipeline. For example, within the ChatQnA pipeline, using GMC one could switch the model used in the embedder, re-ranker, and/or the LLM. Upstream Vanilla Kubernetes or Red Hat OpenShift Container Platform (RHOCP) can be used with or without GMC, while use with GMC provides additional features.
The ChatQnA provides several deployment options, including single-node deployments on-premise or in a cloud environment using hardware such as Xeon Scalable Processors, Gaudi servers, NVIDIA GPUs, and even on AI PCs. It also supports Kubernetes deployments with and without the GenAI Management Console (GMC), as well as cloud-native deployments using RHOCP.
Key Implementation Details
- Embedding:
The process of transforming user queries into numerical representations called embeddings.
- Vector Database:
The storage and retrieval of relevant data points using vector databases.
- RAG Architecture:
The use of the RAG architecture to combine knowledge bases and generative models for development of chatbots with relevant and up to date query responses.
- Large Language Models (LLMs):
The training and utilization of LLMs for generating responses.
- Deployment Options:
production ready deployment options for the ChatQnA example, including single-node deployments and Kubernetes deployments.
How It Works
The ChatQnA Examples follows a basic flow of information in the chatbot system, starting from the user input and going through the retrieve, re-ranker, and generate components, ultimately resulting in the bot’s output.
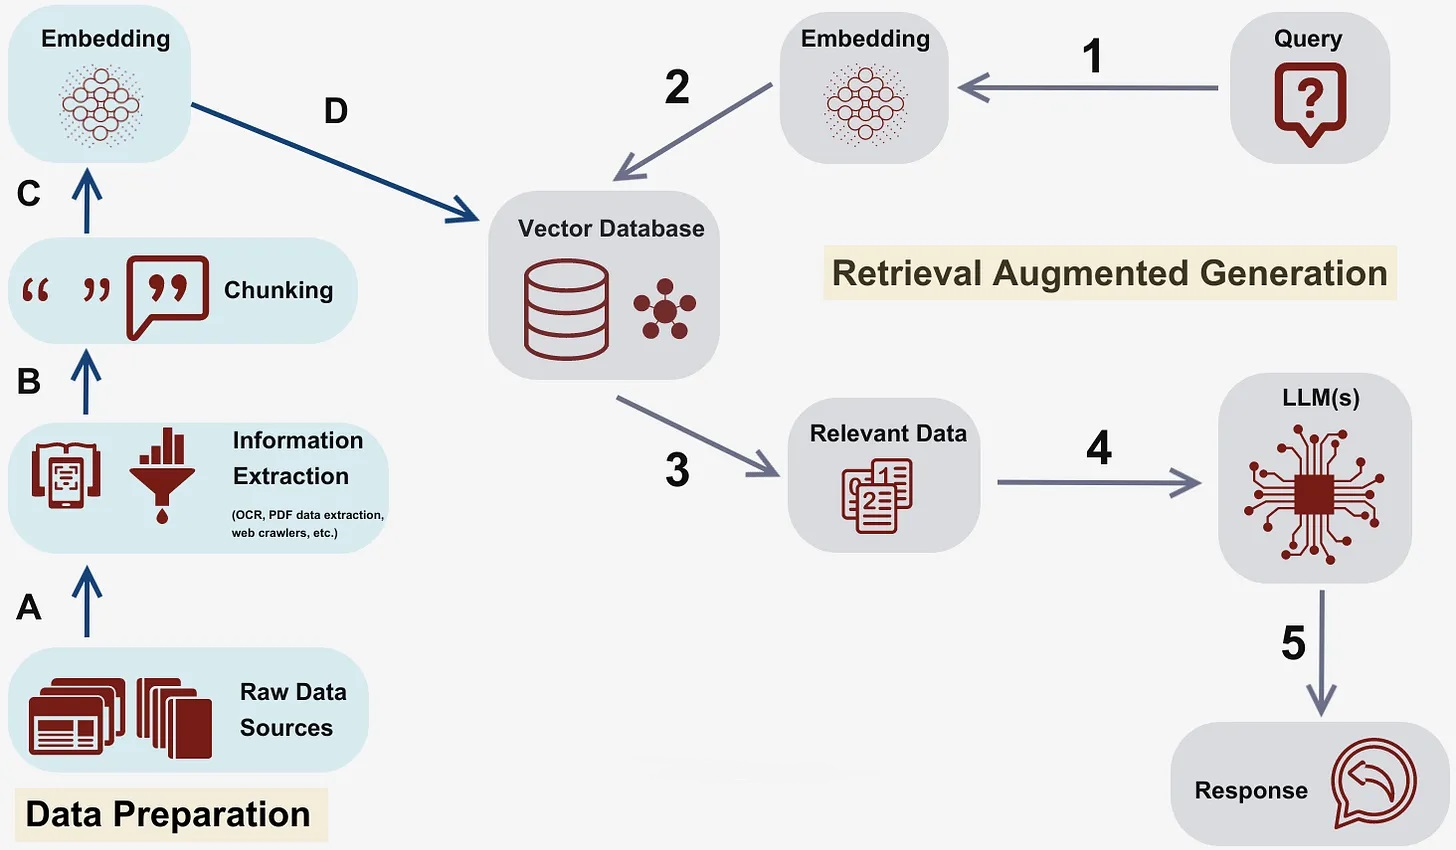
Figure 1 This diagram illustrates the flow of information in the chatbot system, starting from the user input and going through the retrieve, analyze, and generate components, ultimately resulting in the bot’s output.
The architecture follows a series of steps to process user queries and generate responses:
Embedding: The user query is first transformed into a numerical representation called an embedding. This embedding captures the semantic meaning of the query and allows for efficient comparison with other embeddings.
Vector Database: The embedding is then used to search a vector database, which stores relevant data points as vectors. The vector database enables efficient and semantic retrieval of information based on the similarity between the query embedding and the stored vectors.
Re-ranker: Uses a model to rank the retrieved data on their saliency. The vector database retrieves the most relevant data points based on the query embedding. These data points can include documents, articles, or any other relevant information that can help generate accurate responses.
LLM: The retrieved data points are then passed to large language models (LLM) for further processing. LLMs are powerful generative models that have been trained on a large corpus of text data. They can generate human-like responses based on the input data.
Generate Response: The LLMs generate a response based on the input data and the user query. This response is then returned to the user as the chatbot’s answer.
Customize with new VectorDB
Adding a new VectorDB to OPEA involves minimal changes to OPEA sub-project GenAI Components that covers installation, launch, usage, and tests.
For more details, please refer to the following document:
Expected Output
After launching the ChatQnA application, a curl command can be used to ensure the megaservice is working properly. The example below assumes a document containing new information is uploaded to the vector database before querying. .. code-block:: bash
- curl http://${host_ip}:8888/v1/chatqna -H “Content-Type: application/json” -d ‘{
“messages”: “What is the revenue of Nike in 2023?” }’
Here is the output for reference: .. code-block:: bash
data: b’n’ data: b’An’ data: b’swer’ data: b’:’ data: b’ In’ data: b’ fiscal’ data: b’ ‘ data: b’2’ data: b’0’ data: b’2’ data: b’3’ data: b’,’ data: b’ N’ data: b’I’ data: b’KE’ data: b’,’ data: b’ Inc’ data: b’.’ data: b’ achieved’ data: b’ record’ data: b’ Rev’ data: b’en’ data: b’ues’ data: b’ of’ data: b’ $’ data: b’5’ data: b’1’ data: b’.’ data: b’2’ data: b’ billion’ data: b’.’ data: b’</s>’ data: [DONE]
The UI will show a similar response with formatted output.
Validation Matrix and Prerequisites
Architecture
The ChatQnA architecture is displayed below:
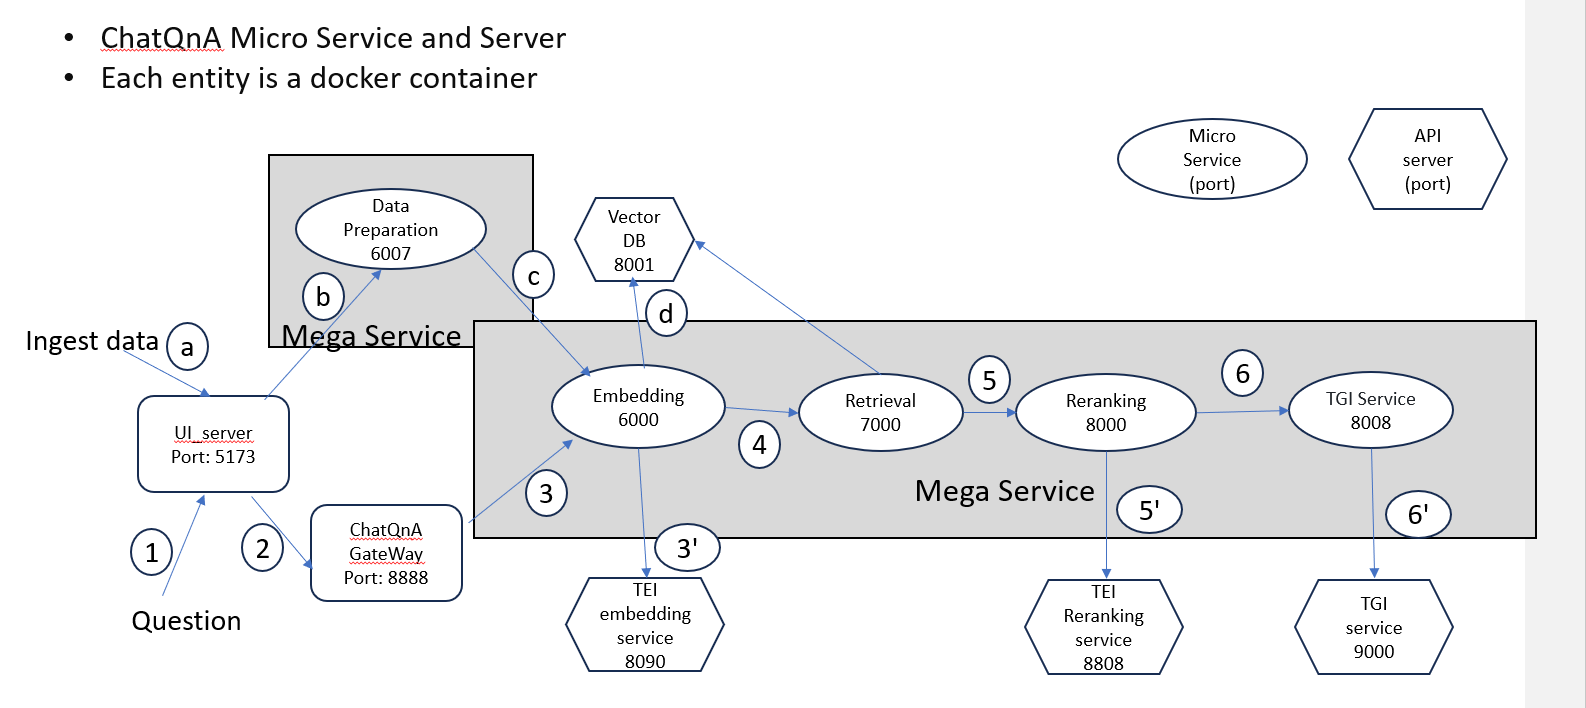
Microservice Outline and Diagram
A GenAI application or pipeline in OPEA typically consists of a collection of microservices to create a megaservice, accessed via a gateway. A microservice is a component designed to perform a specific function or task. Microservices are building blocks, offering the fundamental services. Microservices promote modularity, flexibility, and scalability in the system. A megaservice is a higher-level architectural construct composed of one or more microservices, providing the capability to assemble end-to-end applications. The gateway serves as the interface for users to access. The gateway routes incoming requests to the appropriate microservices within the megaservice architecture. See GenAI Components for more information.
Deployment
Here are some deployment options depending on the hardware and environment. It includes both single-node and orchestrated multi-node configurations. Choose the one that best fits requirements.
Single Node
Kubernetes
Cloud Native
Red Hat OpenShift Container Platform (RHOCP)
Troubleshooting
Browser interface https link failed
Q: For example, started ChatQnA example in IBM Cloud and trying to access the UI interface. By default, typing the :5173 resolves to https://:5173. Chrome shows the following warning message:xx.xx.xx.xx doesn’t support a secure connection
A: By default, the browser resolves xx.xx.xx.xx:5173 to https://xx.xx.xx.xx:5173. But to meet security requirements, users need to deploy a certificate to enable HTTPS support in some cloud environments. OPEA provides HTTP services by default,but also supports HTTPS. To enable HTTPS, specify the certificate file paths in the MicroService class. For more details, please refer to the source code.
For other troubles, please check the doc.
Monitoring
Monitoring the performance of microservices is crucial for ensuring the smooth operation of the generative AI systems. Monitoring metrics such as latency and throughput can identify bottlenecks, detect anomalies, and optimize the performance of individual microservices. This helps proactively address any issues and ensure that the ChatQnA pipeline is running efficiently.
Prometheus and Grafana, both open-source toolkits, are used to collect metrics including latency and throughput of different microservices in real time, and visualize them in a dashboard.
Set Up the Prometheus Server
Prometheus is a tool used for recording real-time metrics and is specifically designed for monitoring microservices and alerting based on their metrics.
The /metrics endpoint on the port running each microservice exposes the metrics in the Prometheus format. The Prometheus server scrapes these metrics and stores them in its time series database. For example, metrics for the Text Generation Interface (TGI) service are available at:
http://${host_ip}:9009/metrics
Set up the Prometheus server:
Download Prometheus: Download the Prometheus v2.52.0 from the official site, and extract the files:
wget https://github.com/prometheus/prometheus/releases/download/v2.52.0/prometheus-2.52.0.linux-amd64.tar.gz
tar -xvzf prometheus-2.52.0.linux-amd64.tar.gz
Configure Prometheus: Change the directory to the Prometheus folder:
cd prometheus-2.52.0.linux-amd64
Edit the prometheus.yml file:
vim prometheus.yml
Change the job_name to the name of the microservice to monitor. Also change the targets to the job target endpoint of that microservice. Make sure the service is running and the port is open, and that it exposes the metrics that follow Prometheus convention at the /metrics endpoint.
Here is an example of exporting metrics data from a TGI microservice to Prometheus:
# A scrape configuration containing exactly one endpoint to scrape:
# Here it's Prometheus itself.
scrape_configs:
  # The job name is added as a label `job=<job_name>` to any timeseries scraped from this config.
  - job_name: "tgi"

    # metrics_path defaults to '/metrics'
    # scheme defaults to 'http'.

    static_configs:
      - targets: ["localhost:9009"]
Here is another example of exporting metrics data from a TGI microservice (inside a Kubernetes cluster) to Prometheus:
scrape_configs:
  - job_name: "tgi"

    static_configs:
      - targets: ["llm-dependency-svc.default.svc.cluster.local:9009"]
3. Run the Prometheus server:
Run the Prometheus server, without hanging-up the process:
`bash
nohup ./prometheus --config.file=./prometheus.yml &
`
Access the Prometheus UI Access the Prometheus UI at the following URL:
http://localhost:9090/targets?search=
>Note: Before starting Prometheus, ensure that no other processes are running on the designated port (default is 9090). Otherwise, Prometheus will not be able to scrape the metrics.
On the Prometheus UI, look at the status of the targets and the metrics that are being scraped. To search for a metrics variable, type it in the search bar.
The TGI metrics can be accessed at:
http://${host_ip}:9009/metrics
Set Up the Grafana Dashboard
Grafana is a tool used for visualizing metrics and creating dashboards. It can be used to create custom dashboards that display the metrics collected by Prometheus.
To set up the Grafana dashboard, follow these steps:
Download Grafana: Download the Grafana v8.0.6 from the official site, and extract the files:
wget https://dl.grafana.com/oss/release/grafana-11.0.0.linux-amd64.tar.gz
tar -zxvf grafana-11.0.0.linux-amd64.tar.gz
For additional instructions, see the complete Grafana installation instructions.
Run the Grafana server: Change the directory to the Grafana folder:
cd grafana-11.0.0
Run the Grafana server, without hanging-up the process:
nohup ./bin/grafana-server &
Access the Grafana dashboard UI: On a web browser, access the Grafana dashboard UI at the following URL:
http://localhost:3000
>Note: Before starting Grafana, ensure that no other processes are running on port 3000.
Log in to Grafana using the default credentials:
username: admin
password: admin
Add Prometheus as a data source: The data source for Grafana needs to be configured to scrape data. Click on the “Data Source” button, select Prometheus, and specify the Prometheus URL
http://localhost:9090.Then, upload a JSON file for the dashboard’s configuration. Upload it in the Grafana UI under
Home > Dashboards > Import dashboard. A sample JSON file is supported here: tgi_grafana.jsonView the dashboard: Finally, open the dashboard in the Grafana UI to see different panels displaying the metrics data.
Taking the TGI microservice as an example, look at the following metrics: * Time to first token * Decode per-token latency * Throughput (generated tokens/sec) * Number of tokens per prompt * Number of generated tokens per request
Incoming requests to the microservice, the response time per token, etc., can also be monitored in real time.
Summary and Next Steps
The ChatQnA application deploys a RAG architecture consisting of the following microservices - embedding, vectorDB, retrieval, reranker, and LLM text generation. It is a chatbot that can leverage new information from uploaded documents and websites to provide more accurate answers. The microservices can be customized by modifying and building them in GenAIComponents. Explore additional GenAIExamples and use them as starting points for other use cases.